In the world of investigations, uncovering links between people, organizations, and events is a primary method to reveal new insights. This process, known as link analysis, has become a powerful tool for a variety of users, from law enforcement agencies and military intelligence, to financial services and not-for-profits.
By examining relationships and connections, link analysis tools aid in understanding complex networks, identifies patterns, and facilitates informed decision-making.
Link analysis is not a new idea. In the 1940s sociologist Jacob Moreno introduced sociograms as a visual representation of social relationships. Later, during the Cold War, intelligence agencies adopted link analysis to map out connections between individuals involved in espionage and criminal activities.
In fact, many of today’s data science approaches date back even further, incorporating techniques from graph theory that have their foundation in Leonhard Euler’s mathematical solution to the Seven Bridges of Königsberg problem in 1736.
With the advancement of computer technology and the exponential growth of data, link analysis tools have become more sophisticated, allowing investigators and analysts to uncover hidden relationships and better understand complex networks.
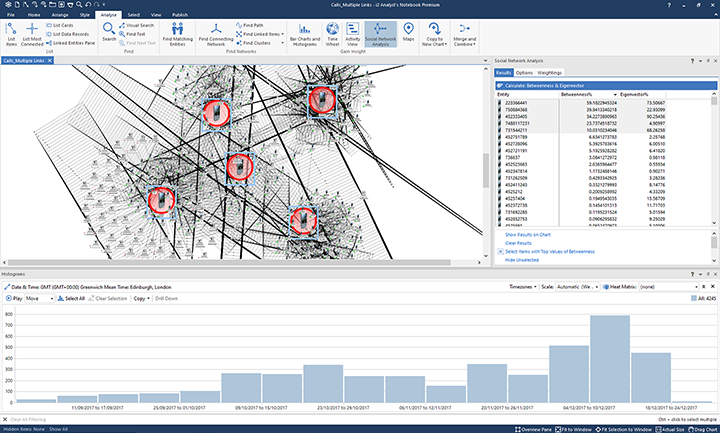
Figure 1: A link analysis graph in i2 Analyst's Notebook
Link analysis is a methodology used to examine and visualize the relationships between entities, such as People, Objects, Locations, and Events - often referred to as the POLE data method.
The aim is to uncover patterns, dependencies, and associations within a network of entities to gain an understanding of the underlying relationships. There are three core applications for which link analysis is used:
An entity is a distinct object or subject such as a person, organization, location, or event. They are represented as nodes in a link analysis graph and are connected with links (see below) that represent relationships between them.
A link is a connection between two entities and indicates some form of relationship, association, or interaction between different entities. For example, this may be an attribution between a person and an event, or a call between two phones.
When first describing link analysis there is often a heavy focus on how the data is visualized.
Commonly referred to as either a link, graph, or network visualization, this is an extremely powerful way to represent how entities are connected by their links.
Analyzing data in this visual format enables rapid identification of interesting patterns in both the positive and negative space, such as high-density clusters of entities, a high volume of interconnectivity between pairs of entities, or even the absence of links where they may be expected.
In the example below, four distinct clusters are revealed. Within the positive space, there are interconnecting entities between pairs of clusters (blue triangles), or three or more clusters (blue diamonds). There are no interconnecting entities between clusters 1 & 2 (negative space).
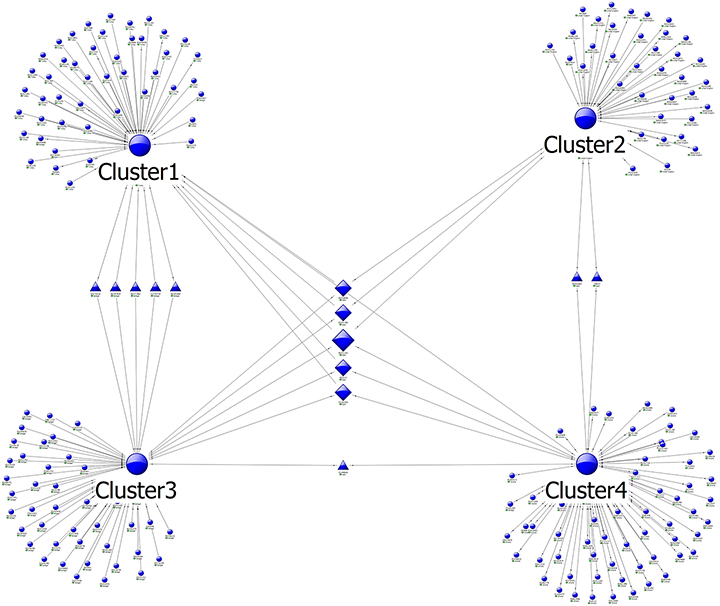
Figure 2: A link analysis graph showing clusters of entities
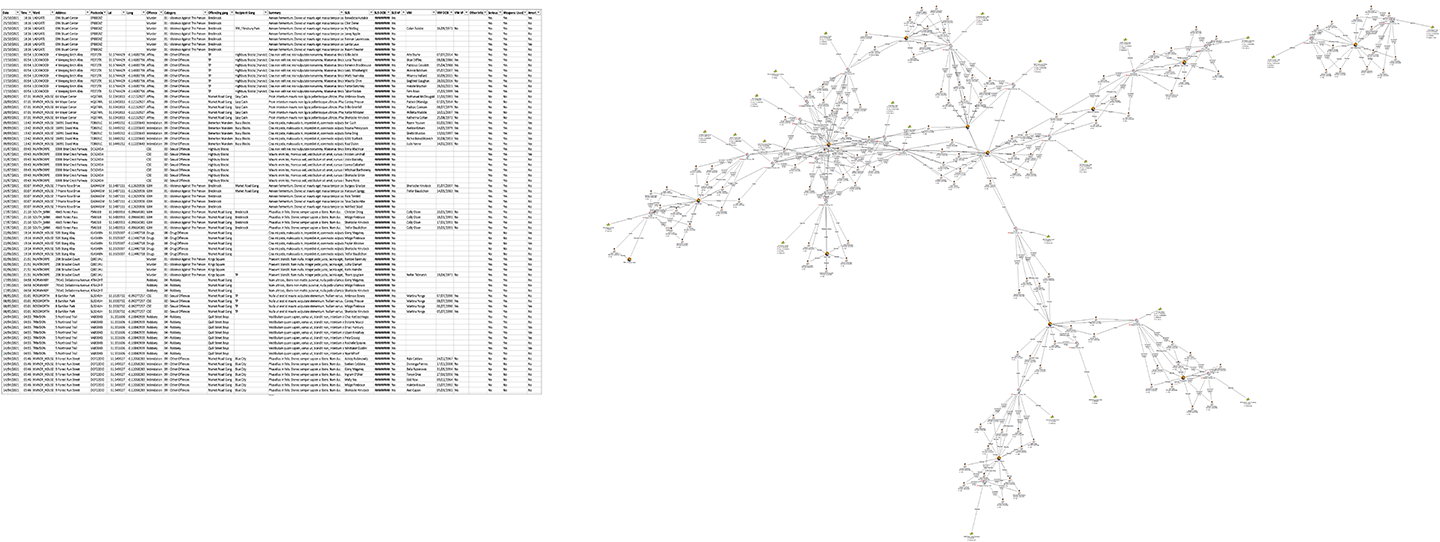
Such links and patterns within the data are not always apparent when simply presented in a tabular format (see below). These visualizations, or graphs, are the basis of link analysis.
As the name suggests, link analysis has a heavy reliance on how entities are connected.
However, there is a key assumption to avoid when interpreting a link analysis graph. Entities and their connections should not necessarily be treated equally. Giving the same weight to one link versus another, or not considering underlying data points, can lead the analyst to make incorrect inferences.
Whilst knowing that entities are linked, the nature of the links enables greater knowledge and understanding of their importance for further analysis. For some data sets, such as communication or financial data for example, the analyst’s understanding of a link analysis graph will consider the communication/transaction type, directionality, frequency of the connections, temporal considerations, or a combination of all. In other words, not all links are equal!
In the example below, financial transactions are shown that present information dependent upon the level of detail required. The first very simple link (top) serves to just show there is a connection between two accounts, the next link adds the number of transactions, then the total value is included, and finally (bottom) the links show individual transactions with various data points (i.e. method, date, value).
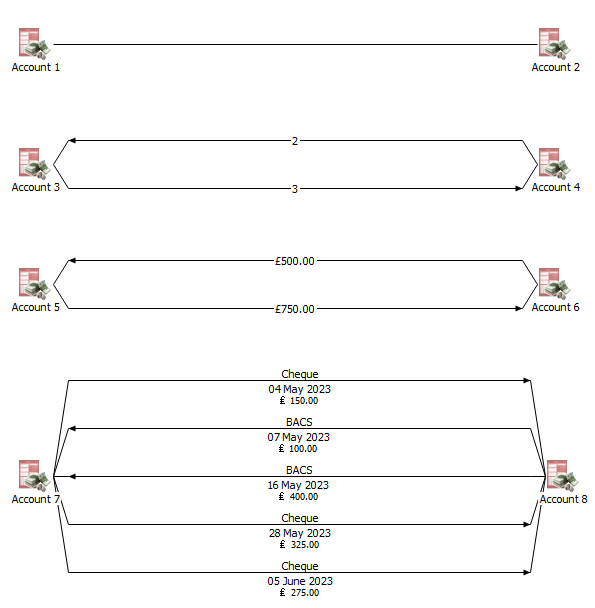 Figure 3: Link analysis graph showing different levels of detail
Creating a link visualization is the foundation to combine analytical methodologies in one place to obtain further insights into the data. Some common tools and techniques used to draw out insights are:
Link analysis is an essential tool for data analysts. By examining connections between suspects, victims, witnesses, and evidence, they can establish links and associations that help establish motives, identify accomplices, and gather critical intelligence.
It provides a comprehensive overview of the relationships within a case, leading to actionable insights and informed decision-making for a range of use cases:
As criminal networks become increasingly sophisticated, the continued development and application of link analysis techniques will remain crucial in the pursuit of justice.
i2 Group's solutions, including the flagship i2 Analyst's Notebook, has revolutionized the way investigators and analysts approach complex cases, across the world.
All our tools offer data integration and advanced analytical capabilities to aid data analysts in understanding relationships and uncovering hidden connections.


© 2026 i2 Group / N. Harris Computer Corporation. All trademarks owned by N. Harris Computer Corporation.
1 Cambridge Square, Milton Avenue, Cambridge, CB4 0AE, UK