Globally, insurance fraud losses are estimated to exceed $1 trillion each year. In the UK, the Association of British Insurers reports that detected fraudulent claims alone top £1.1 billion annually. Big numbers that translate into higher premiums for customers and a heavy burden on insurance companies. With the help of i2 and expert investigators and analysts, insurance firms are fighting back.
In this article, ExamWorks Investigation Services (EWIS) reveals how iBase and i2 Analyst’s Notebook are helping to validate claims and uncover fraud.
Insurance fraud is a serious crime that carries the threat of prison for those convicted, but the impact is felt by us all. Taxpayer-funded resources, such as the courts and NHS, are spent dealing with fraudulent cases, while honest policyholders pay higher premiums to cover the costs of dodgy claims.

The economic and societal burden of fraud is behind why insurers in the UK are investing at least £200 million a year to identify it, says the Association of British Insurers.
At the forefront of the fightback against this criminal activity are firms like ExamWorks Investigation Services a leading claims investigation company with clients in insurance, banking, retail and several other sectors. Their services include liability investigations, fraud detection, screening, surveillance and cognitive interviewing.
And at the fingertips of this large, experienced team of investigators and analysts are i2’s Analyst’s Notebook and iBase. Using these core tools, the team’s objective is simple to explain if not easy to achieve: to validate legitimate insurance claims and uncover the fraudulent ones.
The EWIS workflow typically starts with a bundle of information from the insurer: details about the claim, parties involved, circumstances and supporting documentation. The first step is to cross reference this internal view with what can be found externally.
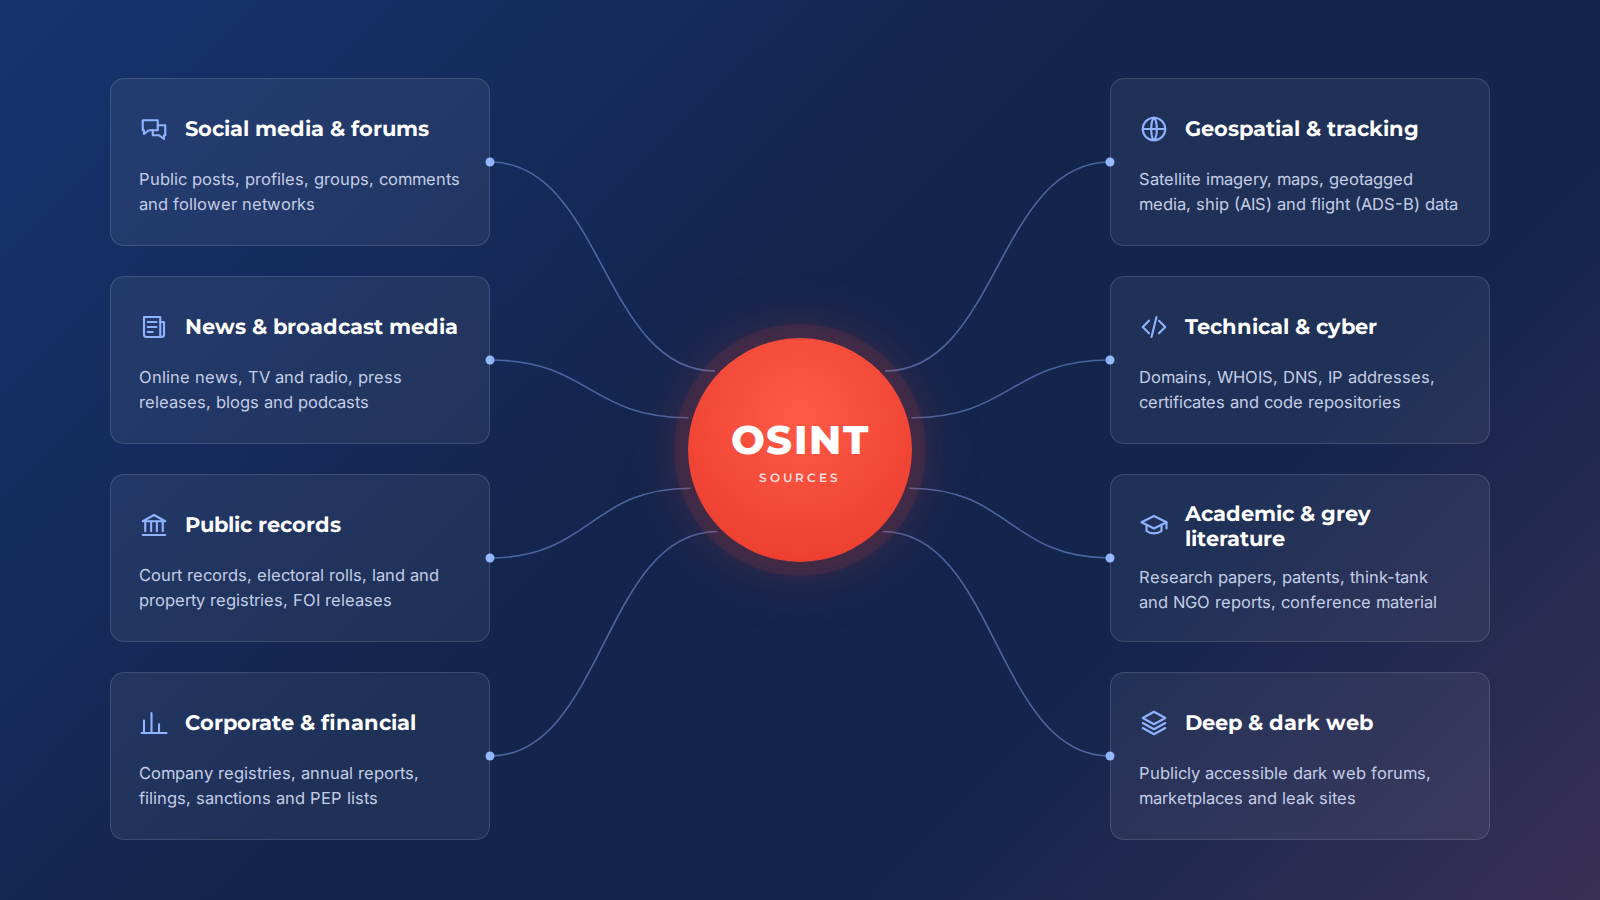
Using OSINT and SOCMINT techniques, analysts look for corroborating or contradicting information in public sources, such as social media profiles, online records and open databases. Relevant findings are fed back into iBase and then represented in Analyst’s Notebook.
This process enables the team to:
confirm that the information supplied is consistent with publicly observable facts
identify associations and links which shouldn’t really be there, such as undisclosed relationships between parties
spot recurring names, companies, or patterns across cases, even years apart
EWIS emphasise that the goal is not to prove fraud at all costs. “It’s a process of validation that we carry out, not just proving parties are at fault,” says Mike Hodge, Head of Research and Intelligence Department Manager.
“Our role varies case by case and is bespoke to our client requirements, however we look at all aspects of a claim and the information presented to validate the content and identify any discrepancies which may warrant further review.”
“The client in many cases may have limited information relating to the event or involved parties and it is our role to identify the missing or incomplete data to provide them a better understanding of the circumstances.”
Before adopting i2 technologies, EWIS’s data landscape looked like that of many investigative teams. EWIS analyst Nick Mason describes the shift to iBase as a move from distributed, fragile record keeping to a centralised, queryable database.
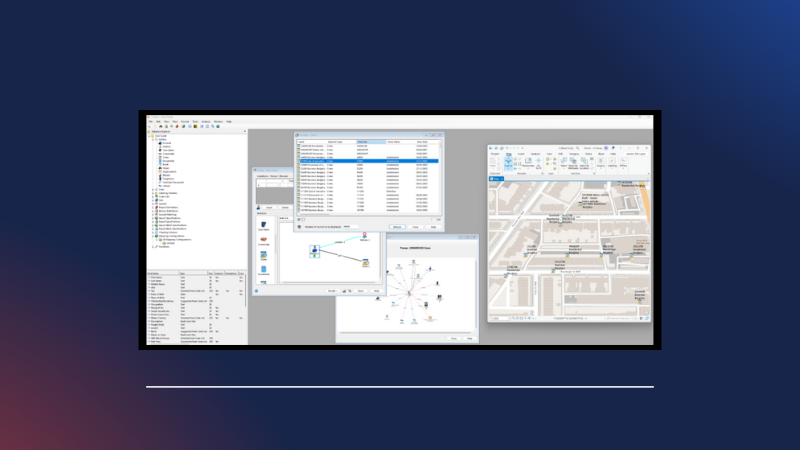
“It was Excel spreadsheets and handwritten records,” says Nick. “(By moving to iBase), you were effectively cutting down what used to be multiple people’s job just to keep track of everything and relying on them to talk to each other fluently to catch everything. Now you’re centralising everything into a database that can be handled by a few people, to which every qualifying person has access and full knowledge of what’s in it.
“In terms of using it as an investigative tool, if you’ve got the permissions and access to the data, you know exactly what’s in there and you can find it. You’re not relying on the human element of ‘filing cabinet C on floor six’. There’s no data loss; you’re working with the full amount of data you could have access to.”
Into iBase flow multiple data sources:
Information supplied by insurers as part of a claim
Open source and social media intelligence (OSINT and SOCMINT)
Each “pertinent data point” is normalised and stored in the database. “This single repository reduces the risk of data loss and gives analysts confidence that when they search, they are working with the full picture they are allowed to see”, says Nick.
The central store also simplifies data protection and GDPR compliance. “For GDPR, you’re dealing with one central location where, with a few clicks of a button, you can set the rules up to anonymise things, delete them or edit them, as opposed to going to multiple locations and making sure you’ve caught every handwritten or electronic record,” says Nick. “The digitisation of records definitely assists with that – it’s much easier”.
“You have a singular process that you can audit and prove – you can show that a process has run and here are the results – rather than trying to track it across different systems.”
For clients, of course, using iBase is strengthening assurance that sensitive personal data is being handled systematically.
If iBase is EWIS’ core database for investigators, Analyst’s Notebook is the investigative workspace. Here, the team is working day to day, pulling from iBase to create visual representations of people, companies, events and the links between them.
Nick says, “Analyst’s Notebook really comes into its own on larger-scale investigations where you’d be overwhelmed by the amount of data points. You’d be relying on human memory to make your connections. Instead, you can throw data points at Notebook and, with a couple of clicks, say ‘show me what is linked to this particular thing’ or ‘how many data points have N plus links to them’, and immediately home in on the right areas to focus your time on. Its main benefit is doing a lot of the heavy lifting of data sifting so you can focus your investigations better.”
In sum, the analyst can spot patterns and outliers in Analyst’s Notebook and so identify where to focus deeper OSINT work.
Take this example. EWIS described how i2 had helped the team understand a large ghost broking organised crime network by identifying links and commonalities between entities. The data points were related to insurance policies that, on initial inspection, outside of i2 have little commonality.
Using i2 alongside investigation searches enabled the clear identification of associations between numerous data points within the policies and validated some of this data as false.
In Ghost Broking cases, this has enabled clients to minimise risk and limit financial exposure.
Of course, insurance fraud investigations do not end with the analyst getting a deep understanding of the case. Those insights inform decisions taken by others, such as a claim handler, a manager, legal counsel or a judge. And that decision maker is very often not a technical user of databases or investigative tools.
It is in this pass of information where Analyst’s Notebook’s visualisation capabilities become especially important.
“Many clients don’t have extensive knowledge of database visualisers but effectively you’re adding clarity in the form of imagery into reports or presentations,” says Nick. “It does wow people who haven’t seen it before. Previously you might have needed six or seven paragraphs of a report to explain what a link was, whereas now you can just present the chart and people immediately understand it.”
“We’re often dealing with very specialised datasets and a lot of technical language, but everyone can understand icons and link lines between people. It makes it easier to help people follow along, rather than running into the weeds with technical speak.”
For non specialists, these visuals can transform complexity into a clear picture. For technical teams, they offer a concise way to communicate the findings. For courts, they can be turned into large, static exhibits that explain organised crime networks and fraud rings at a glance.
“In court cases where I have historically attended as an expert witness, i2 charts have been used as a visual aid to explain the associations in large or complex fraud cases where the associations and links are numerous and show collusion or direct/indirect interactions” says Mike.
“It’s used as a pictograph to show, associations and links in a clearer way, to people who may not have encountered this process before.”
Fraud investigation work is complex, but with the help of i2 Analyst’s Notebook and iBase, EWIS have managed to:
move from fragmented, human dependent records to a structured database in iBase
shift from manual connection spotting to visual, repeatable analysis in Analyst’s Notebook
For insurers facing rising fraud risk, regulatory pressure and scrutiny from both customers and regulators, EWIS’s approach offers a model: combine investigative expertise with i2’s world class solutions, and transform raw, messy data into reliable intelligence that stands up to challenge.




© 2026 i2 Group / N. Harris Computer Corporation. All trademarks owned by N. Harris Computer Corporation.
1 Cambridge Square, Milton Avenue, Cambridge, CB4 0AE, UK